Pointing model run 2021/09
This run was a follow up of Pointing model run 2021/08, used to verify the pointing model obtained during the previous run and taking more data to validate/improve the pointing model. The lookup tabled used during this run is also the same as the previous run.
Observations
The data for this run was taken following a similar procedure to that of Observations.
A summary of the observations is shown in Observation journal.
| Night | Number of observations |
|---|---|
| 2021/09/07 | 69 |
Data Analysis
The data analysis follows a similar procedure to that of Data Analysis.
EFD Data Mining
papermill -p year 2021 -p month 09 -p day 07 -p time_window 2 -p data_path /readonly/repo/main reducing_pointing_data.ipynb reducing_pointing_data/20210907_tw002.ipynb
Generating Pointing File
papermill -p pointing_data_file data/20210907/AT_point_data_20210907_tw002.pickle build_pointing_data.ipynb build_pointing_data/20210906_tw004.ipynb
Generating Pointing Model
Fitting a simple 7-parameter pointing model to the data yields;
    coeff          value    sigma

1     IA         -294.42    2.410
2     IE         -240.27    2.782
3     CA          +89.47    1.620
4     AN          +39.21    0.465
5     AW          +67.92    0.457
6     TF          -84.26    9.297
7     TX10        +23.42    3.671

Sky RMS =   3.35
Popn SD =   3.54
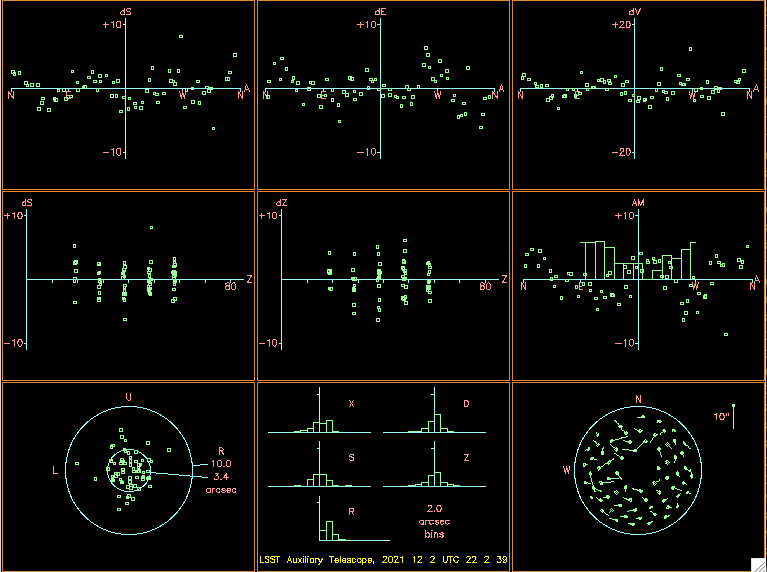
Figure 4 below shows the diagnostics plots from this model.

Figure 4 The “9 favorite plots for altazimuth”. This plot gathers the 9 most relevant plots with information about the pointing model fit for an altaz mount.
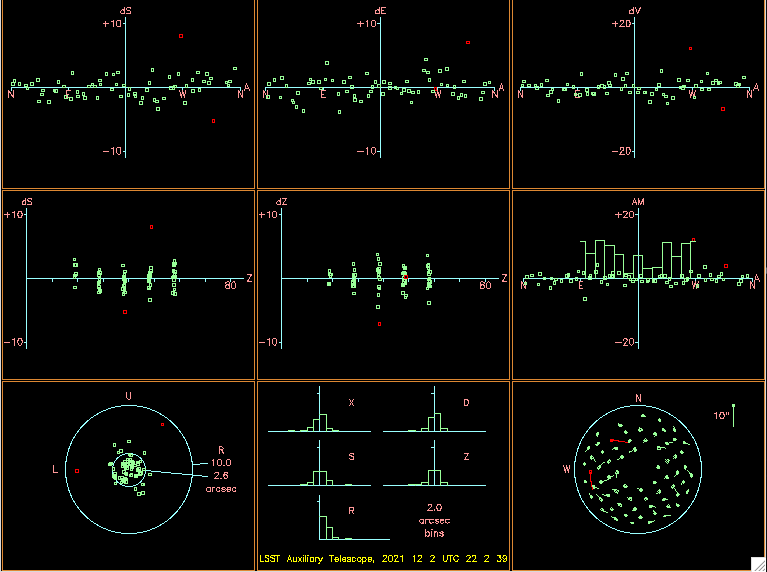
As before, we still observe some correlated errors on the top-most diagnostics plots. Using a higher order model we are able to eliminate most of these and obtain a slightly better sky rms. Nevertheless, we are still concerned with overfitting the data and advise on using the simpler model above.
The results of the higher order fit are as follows:
    coeff           value    sigma

1     IA          -294.12    1.555
2     IE          -203.56    1.147
3   & HESA2         +1.43    0.376
4   & HESA3         -2.39    0.386
5   & HESE3        +21.64    1.492
6   & HVCA3         +2.31    0.495
7     NPAE          +0.00
8     CA           +89.26    1.045
9     AN           +38.94    0.304
10     AW           +67.61    0.301
11     TX10         +15.03    1.779

Sky RMS =   2.16
Popn SD =   2.34
The diagnostics plots for the model above are in Figure 5
